

Operations Visibility
See what's happening across your operation while you can still act on it.
Most manufacturers already have the data. It's just spread across the ERP, shop systems, and a dozen spreadsheets. We pull it into live views of throughput, downtime, scrap, and on-time delivery, so decisions get made on today's numbers instead of last week's report.
Free 30-minute call, no obligation
Data Without Answers
You Have the Data. You Don't Have the Visibility.
Most manufacturers already collect enough data to run the business well. It's in the ERP, the MES, the quality system, the maintenance logs, and a dozen spreadsheets. Nobody can see it in one place, in real time, in a form that helps make a decision.
Signs of a visibility gap:
- Leadership gets weekly PDFs instead of live dashboards
- Throughput and OEE are calculated by hand in spreadsheets
- Bottlenecks are identified after the fact, not in the moment
- Labor utilization, scrap, and downtime data live in separate systems
- Each department reports its own numbers, and none of them match
- Power BI is installed, but nobody uses the reports
What We Build
Reporting Built on Your Data, Not a Canned Template
We connect to the systems you already run, including ERP, MES, quality, maintenance, and anything custom, and build reporting that reflects how your operation actually measures performance. Real-time dashboards, automated alerts, and executive views leadership will actually open. Everything we handle, grouped by what it does for your operation.
See the floor live
Know what's happening now, not at the end of the week.
Real-Time Production Dashboards
Live throughput, job status, and line performance from your ERP and shop systems.
OEE & Equipment Performance Tracking
OEE, availability, and utilization by line or machine, from live production data.
Supports Downtime ReductionAutomated Alerts & Exception Reporting
Alerts when throughput drops, a machine goes down, or a metric crosses a threshold.
Measure what drives cost
Track the numbers behind margin and capacity.
Scrap, Rework & Quality Analytics
Scrap rates, rework hours, and nonconformance trends with root-cause tags.
Supports Scrap & Quality ImprovementLabor Utilization & Efficiency Reporting
Productive hours by shift, department, or job, so staffing follows the data.
Supports Labor ProductivityExecutive KPI Dashboards
Revenue, throughput, on-time delivery, and margin in one view for leadership.
Report with confidence
One set of numbers every department trusts.
Power BI Integration & Reporting
Power BI models on clean, connected data that refresh automatically and match across departments.
Data Warehouse & Multi-System Consolidation
One data layer that rolls up reporting across plants, entities, and ERPs.
Custom Reports for Auditors, Customers & Compliance
ISO, customer scorecard, and regulatory reports generated on demand.
Typical results
What changes when leadership can see the operation clearly
Decisions get made on current numbers, bottlenecks get caught before they compound, and the weekly scramble to pull the report disappears.
60%
Average reduction in time spent building weekly reports
35%
Typical improvement in detecting performance issues
40%
Average drop in reporting discrepancies across teams
Typical improvements reported for systems like these. Results vary by operation.
Systems deployed inside real operations
Operational Impact in Action
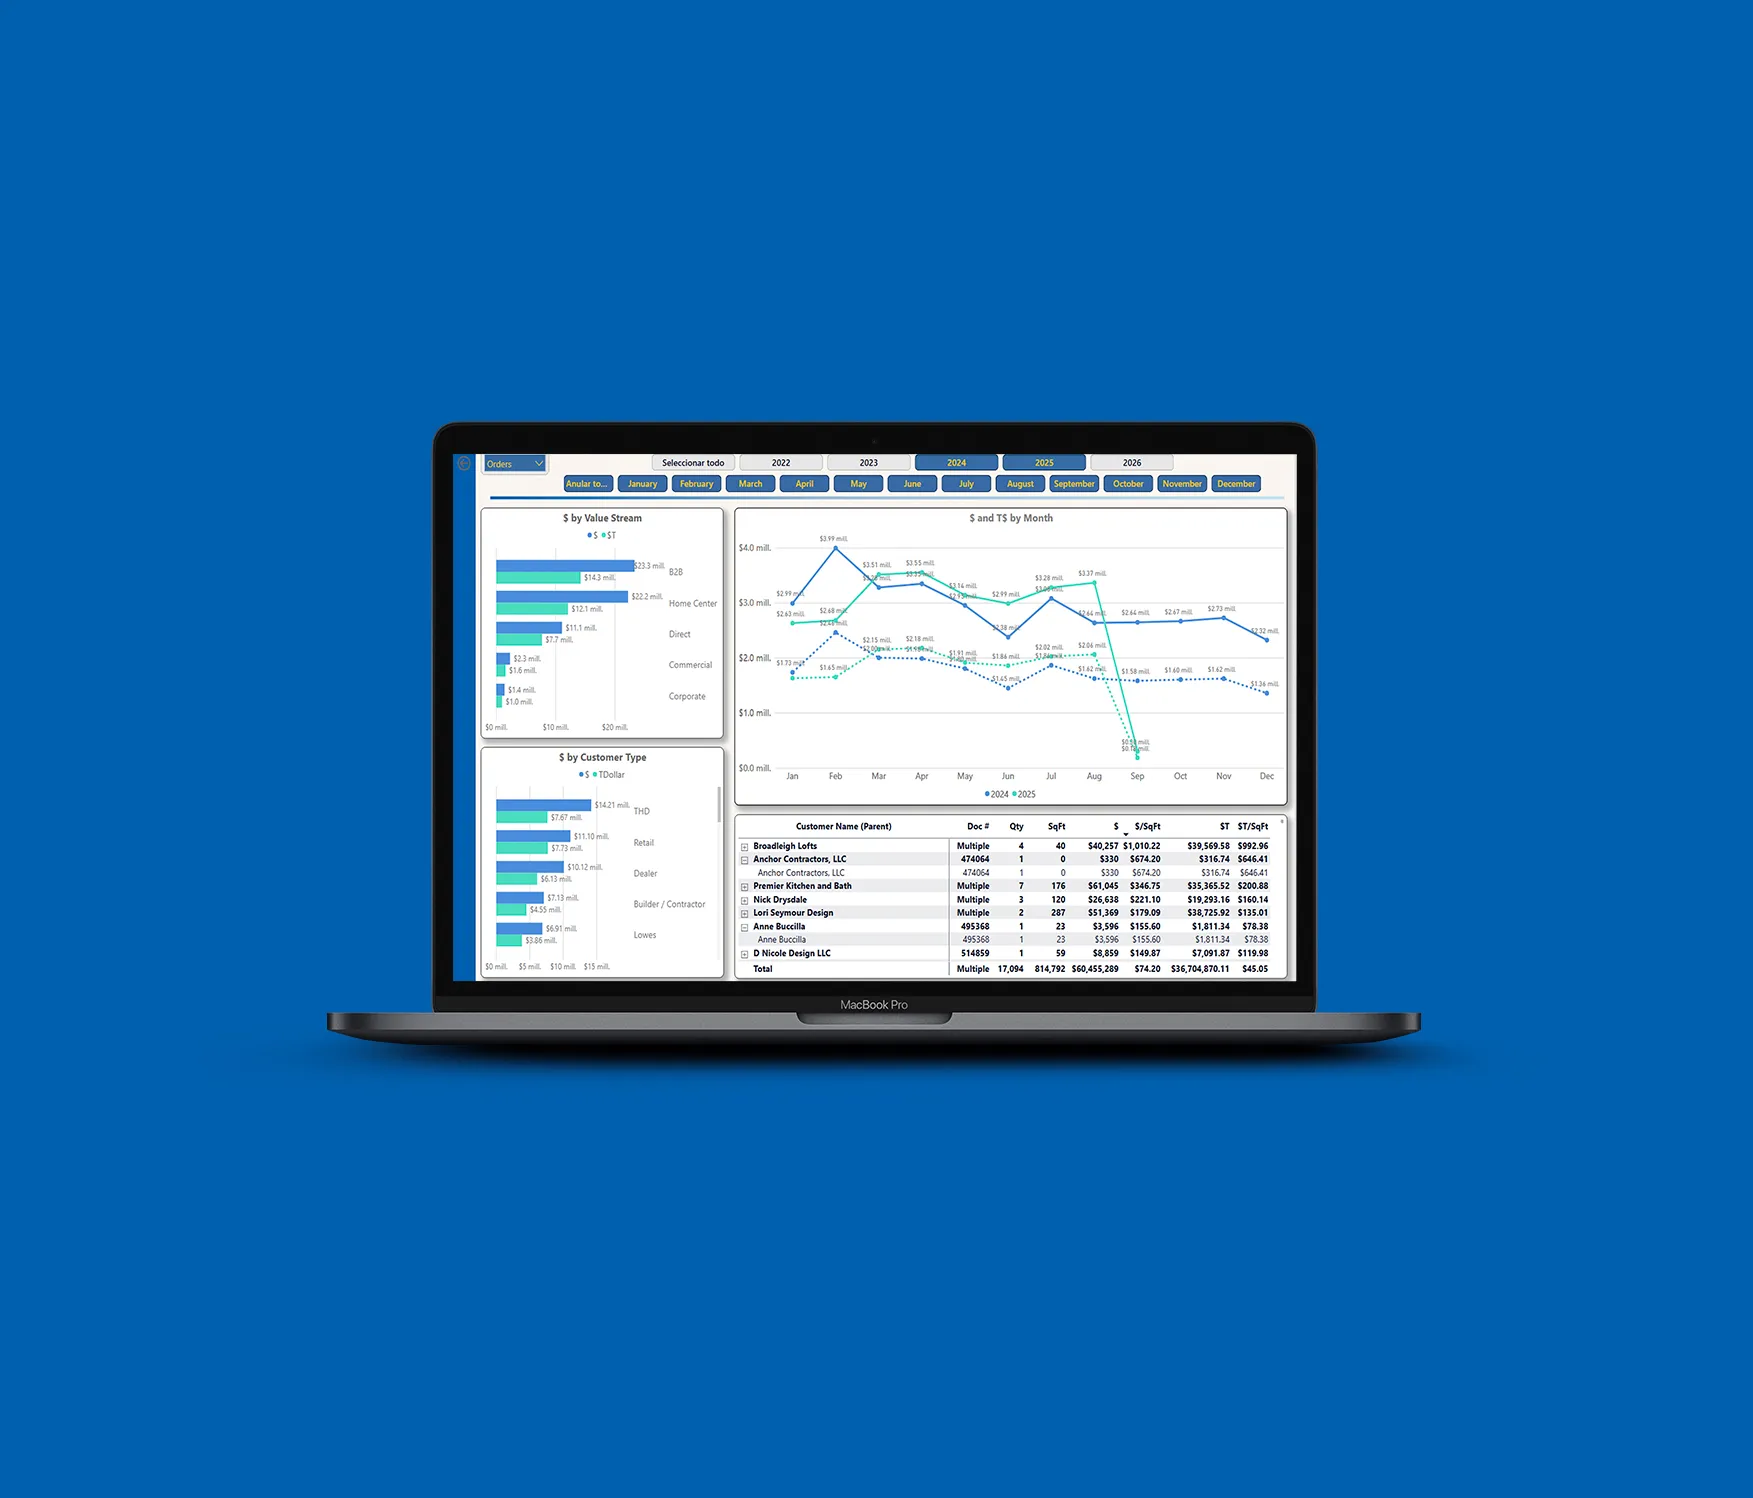
Business Intelligence & Manufacturing Analytics
A three-tiered Power BI suite for operational and financial visibility.
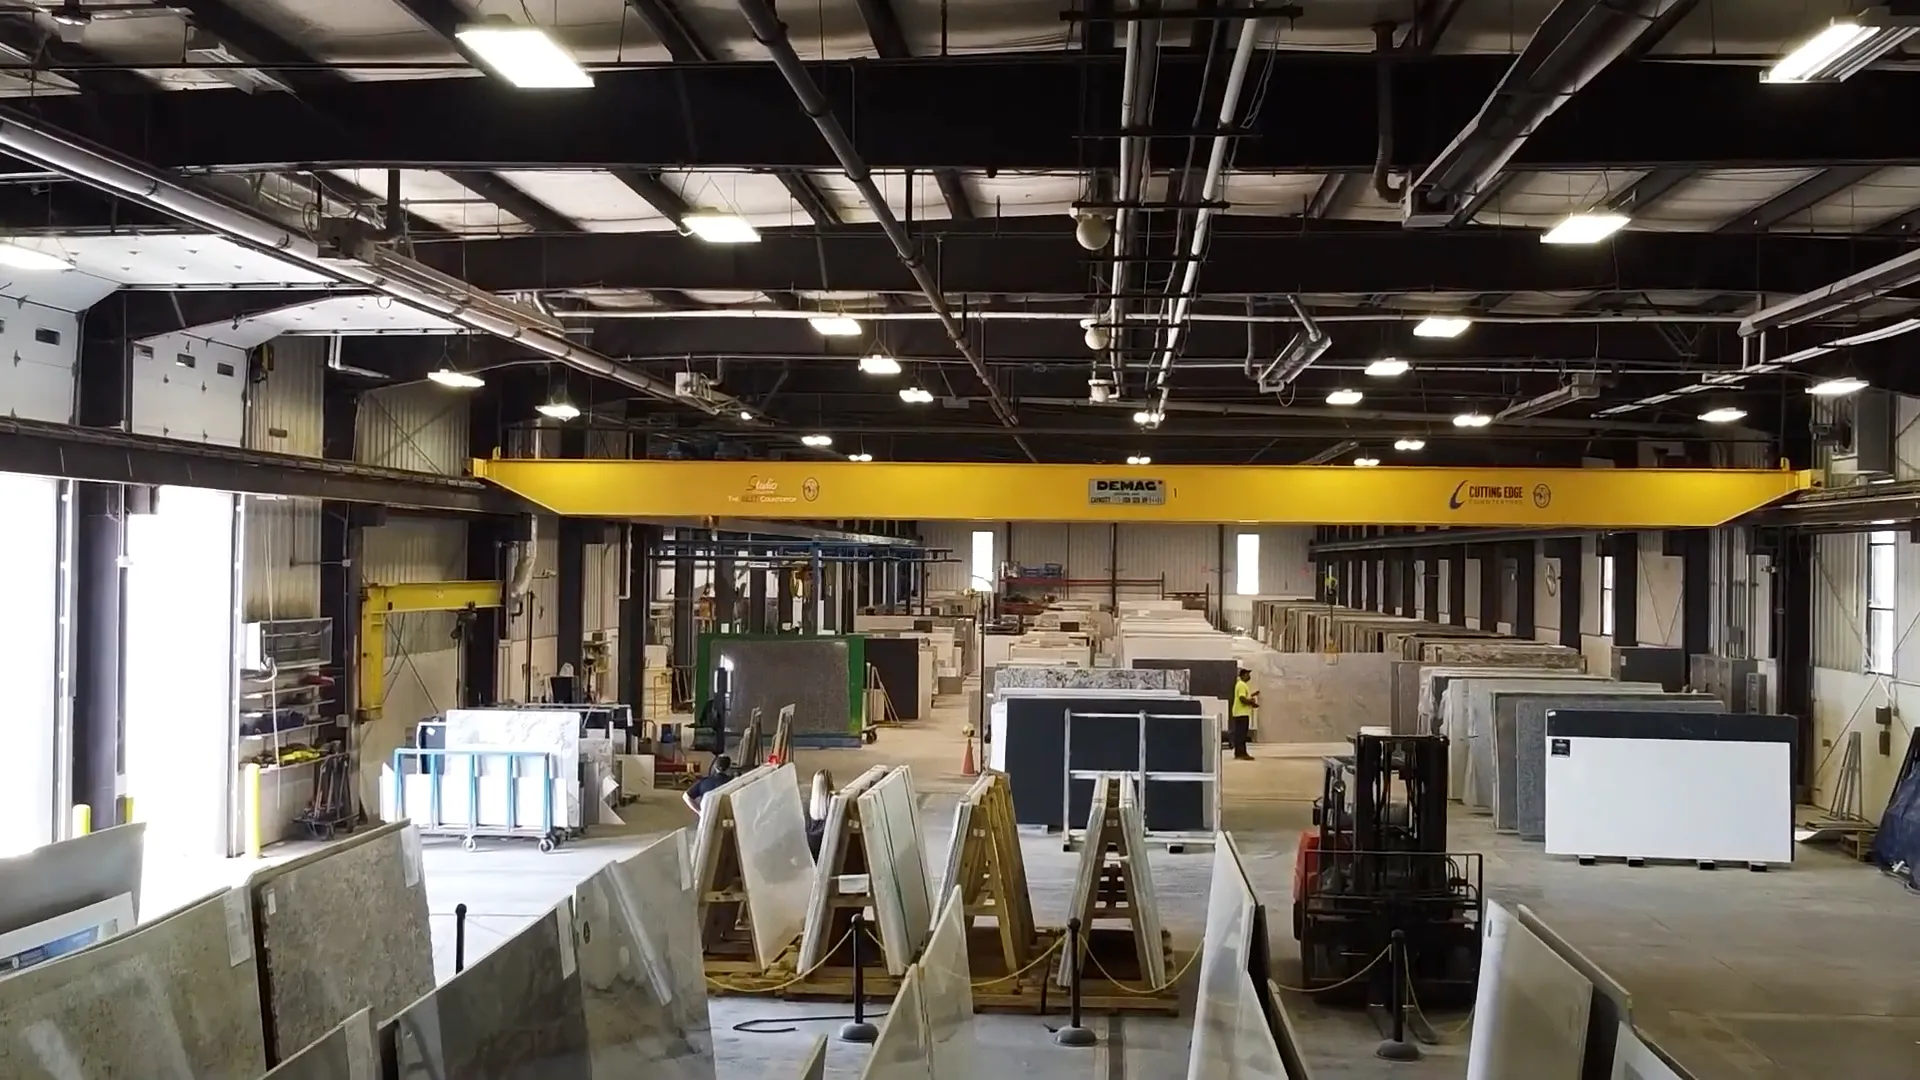
Field Service App & ERP Modernization for a Custom Manufacturer
Maximizing efficiency through legacy migration and mobile optimization.
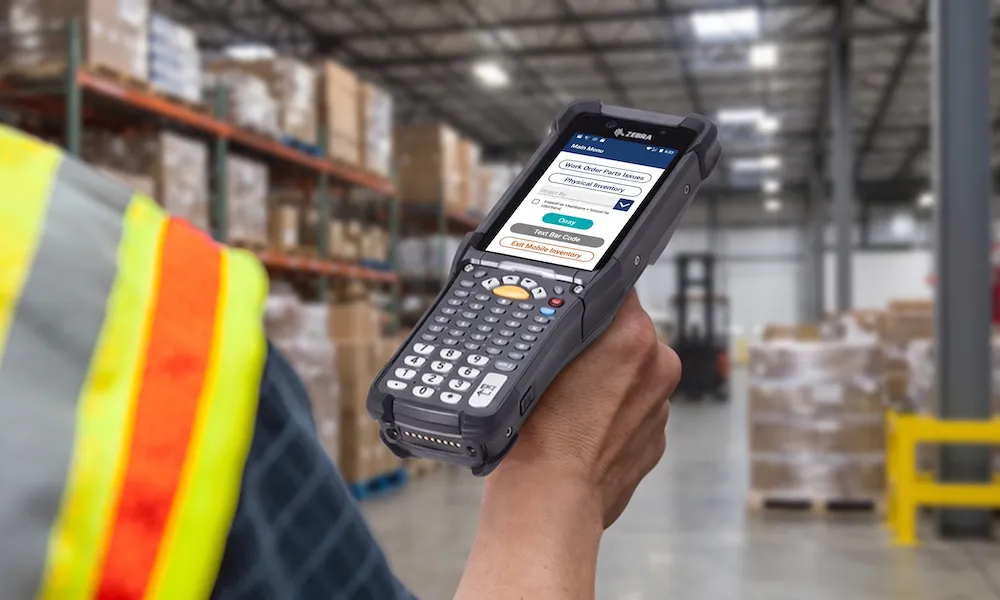
Zebra-Integrated Cycle Count App for Warehouse Operations
Built for the City of Appleton to modernize inventory counting with mobile barcode workflows.


How it works
From scattered reports to one live view.
The same path every engagement follows, focused on the numbers your team needs.
Assess
We find where your numbers live today, which ones leadership actually needs, and what delays and mismatches are costing you.
The assessmentDesign & Scope
We design the views with the people who will use them and agree on the handful of numbers that matter. You approve a plan and a fixed price.
How Design & Scope worksBuild
We connect your systems and build live dashboards and alerts, starting with the view that matters most.
Sustain
We keep the data accurate as your systems change and add new views as new questions come up.
Ongoing support
Testimonials
Rated 4.9/5 on Clutch and backed by client results
Successful deployment of projects into our production environment within desired timeframe and budget.
The team is able to speak intelligently about what they're going to do and what potential issues would be. I've had a lot of contractors just nod their heads, without knowing what I'm asking for, and do whatever they want. Denovo Studios really took the time to understand what I was looking for.
I've worked with Denovo Studios for over a year now and the process has been absolutely seamless.
Get started
Stop guessing where the money is going.
Book a free call. We'll talk through what you're seeing and recommend where to start.